Identifying Fraud from Enron Emails
Ioannis K Breier
Introduction
Summarize for us the goal of this project and how machine learning is useful in trying to accomplish it. As part of your answer, give some background on the dataset and how it can be used to answer the project question.
In 2000, Enron was one of the largest companies in the United States. By 2002, it had collapsed into bankruptcy due to widespread corporate fraud. In the resulting Federal investigation, a significant amount of typically confidential information entered into the public record, including tens of thousands of emails and detailed financial data for top executives.
This data has been combined with a hand-generated list of persons of interest (POI) in the fraud case, which means individuals who were indicted, reached a settlement or plea deal with the government, or testified in exchange for prosecution immunity.
The dataset, before any transformations, contained 146 records consisting of 14 financial features (all units are in US dollars), 6 email features (units are generally number of emails messages; notable exception is ‘email_address’, which is a text string), and 1 labeled feature (POI).
The aim of this project is to create a model that, using the optimal combination of the available features, can identify whether a person is a POI or not.
Since the dataset contains financial and email information that is common among most corporations it could potentially be used to help identify person of interests in similar situations in other companies.
Data Exploration - Outlier Investigation
Were there any outliers in the data when you got it, and how did you handle those? [relevant rubric items: “data exploration”, “outlier investigation”]
Using exploratory data analysis (EDA) I was able to identify outliers, relationships and patterns in the dataset.
I initially identified and removed the following records:
TOTAL: An extreme outlier that represents the sum of all the numerical data.THE TRAVEL AGENCY IN THE PARK: This record is obviously not an ENRON employee.LOCKHART EUGENE E: This record contained only nulls and is therefore not useful.
After removing the the above records the dataset contains 143 observations and 21 features that have a lot of missing values as can be seen below:
The number of POIs is 18 representing a 12.58% of the total number of individuals.
We can still observe in the below boxplots visible outliers in most features. These outliers do represent a significant proportion of the executives of the company and can not be removed.
We can also observe that the Email features have a totally different scale than the financial features.
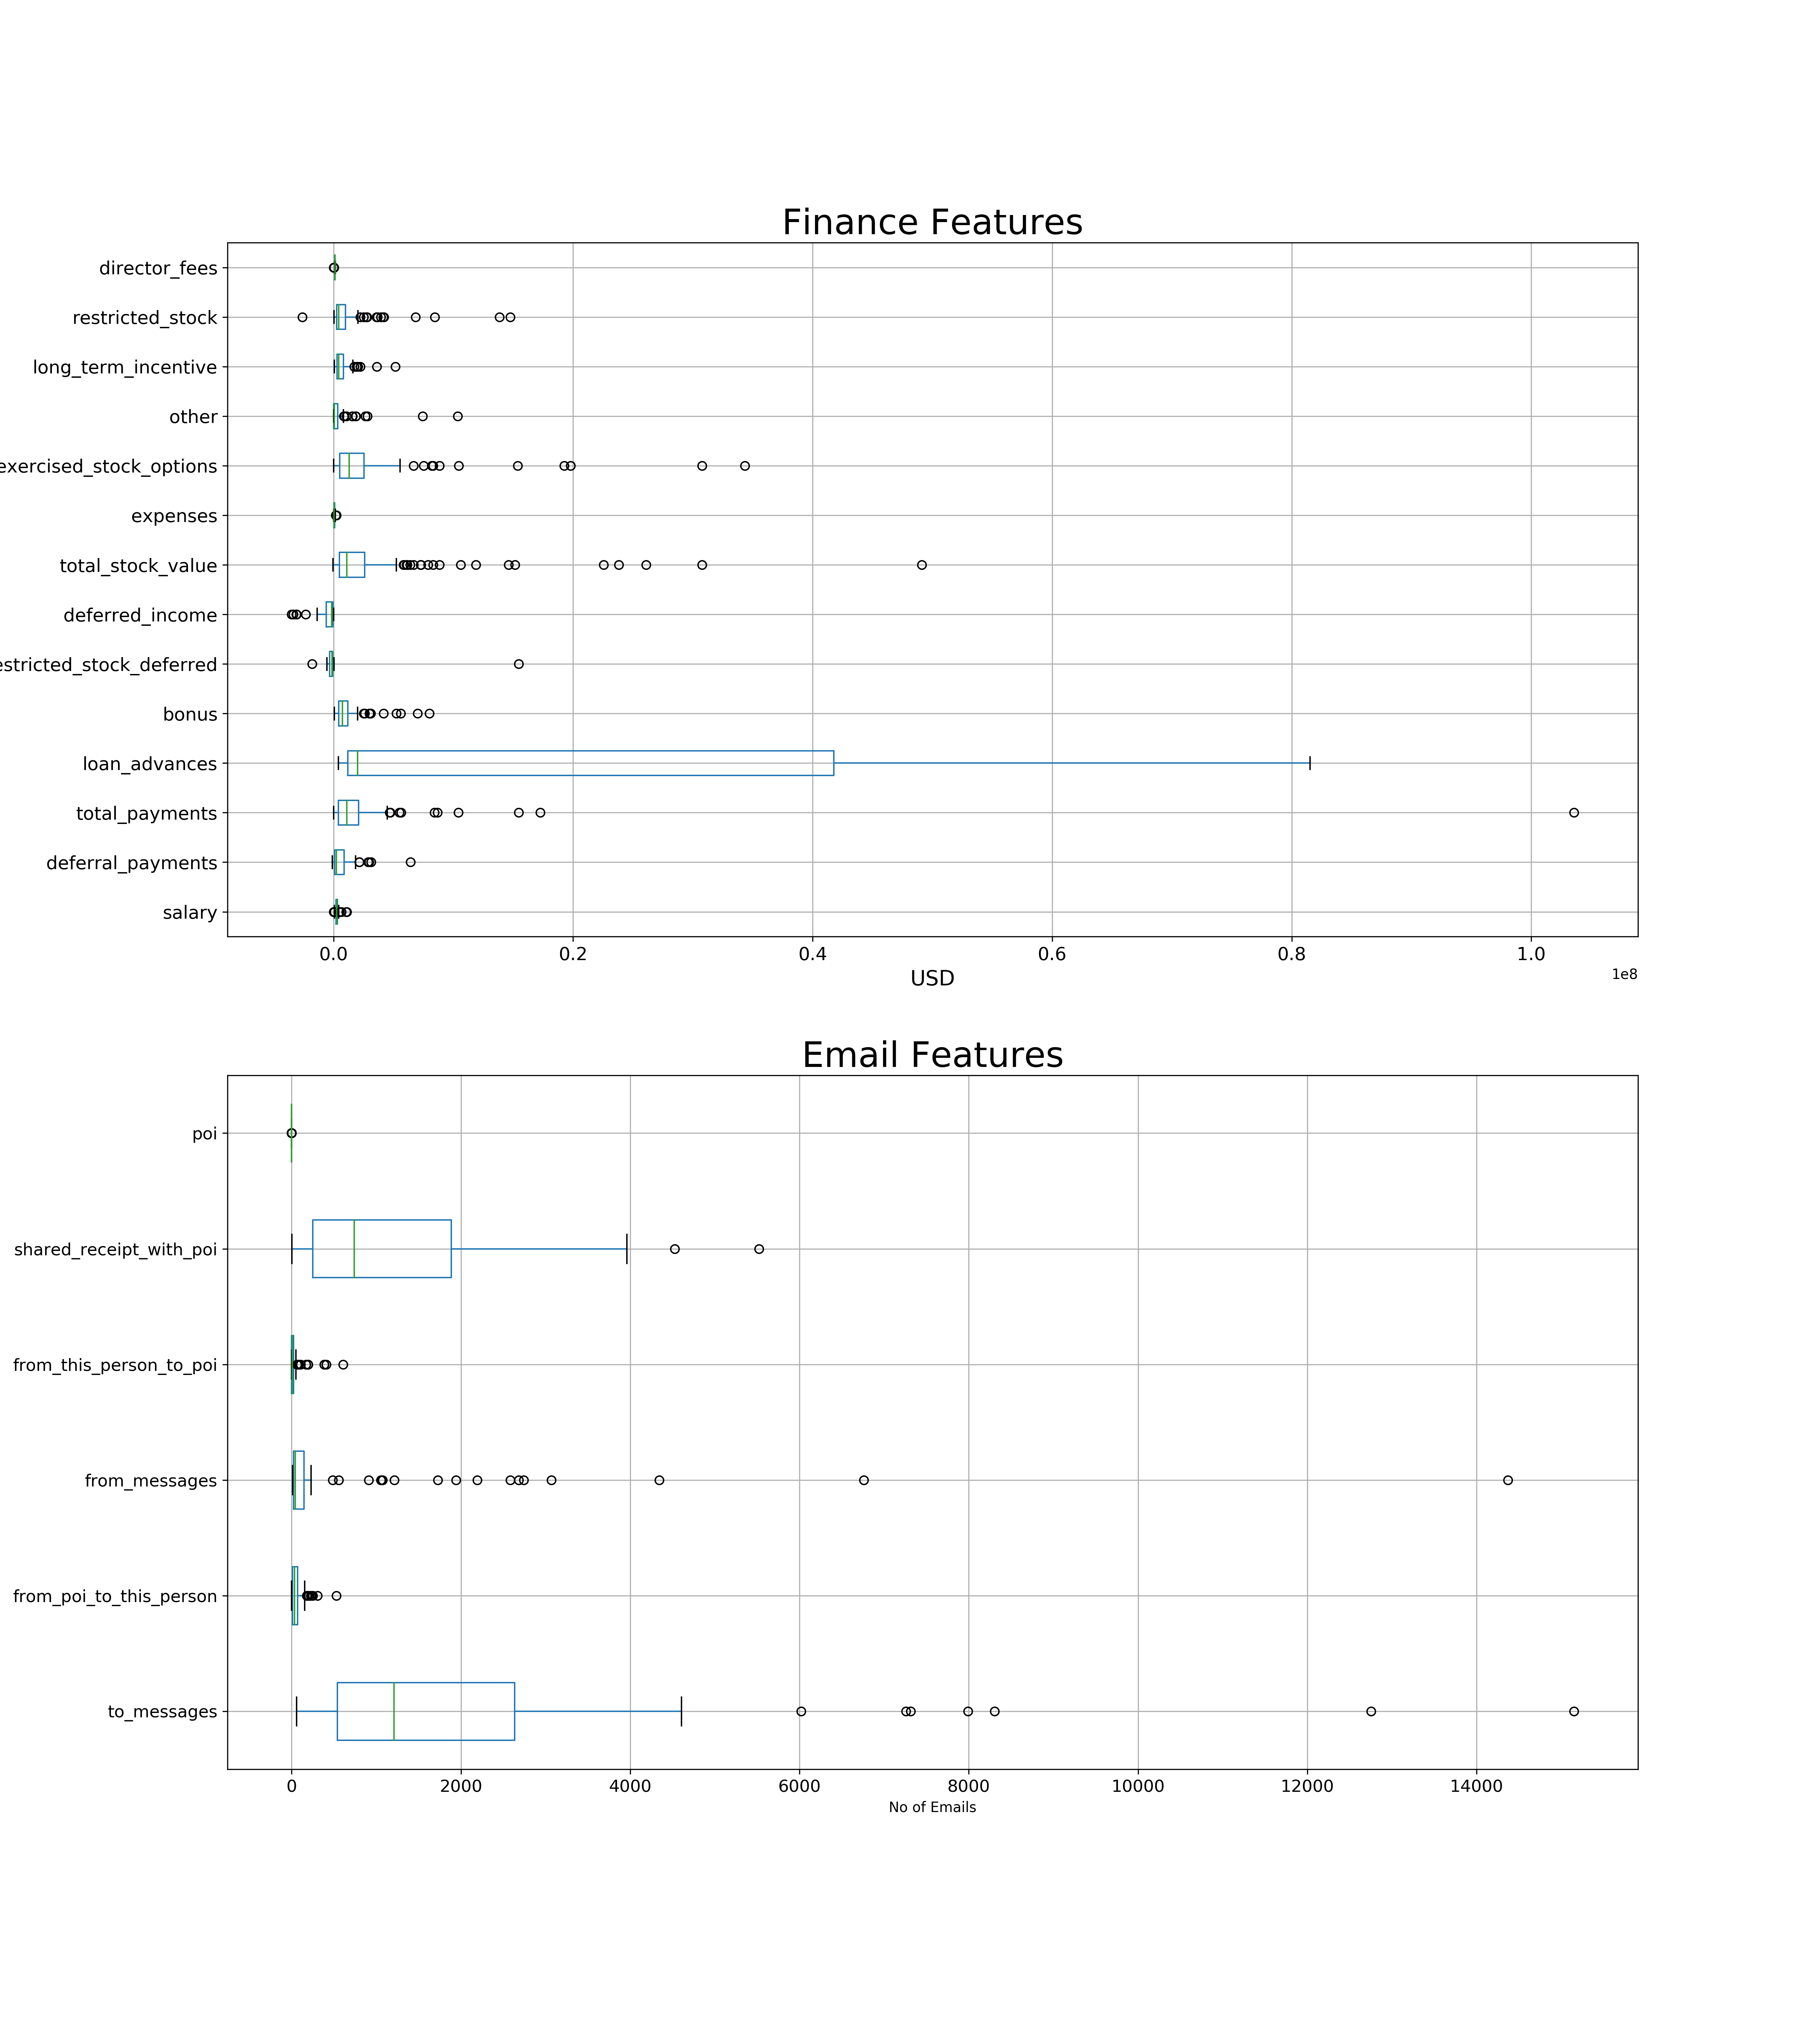
I used feature scaling to handle these outliers and the different scale of the different feature types.
Feature Selection and Scaling
What features did you end up using in your POI identifier, and what selection process did you use to pick them? Did you have to do any scaling? Why or why not? As part of the assignment, you should attempt to engineer your own feature that does not come ready-made in the dataset -- explain what feature you tried to make, and the rationale behind it. (You do not necessarily have to use it in the final analysis, only engineer and test it.) In your feature selection step, if you used an algorithm like a decision tree, please also give the feature importances of the features that you use, and if you used an automated feature selection function like SelectKBest, please report the feature scores and reasons for your choice of parameter values. [relevant rubric items: “create new features”, “intelligently select features”, “properly scale features”]
I used MinMax scaling to convert all the features to a uniform scale. The motivation to use this scaling was to preserve zero entries in sparse data as is this dataset.
Note: Not all algorithms require feature scaling. For example, the Decision Tree doesn't require scaling because it doesn't rely on the Euclidean distance between data points when making decisions.
I created two new features: fraction_from_poi, which represents the ratio of the messages from POI to this person divided with all the messages sent to this person, and fraction_to_poi, which is the ratio from this person to POI divided with all messages from this person.
Univariate feature selection works by selecting the best features based on univariate statistical tests.
I used the univariate feature selection, SelectKBest, which selects the K highest scoring features based on a scoring function that returns univariate scores.
Because our data is sparse I chose chi2 as the scoring function which is recommended for sparse data as it will deal with the data without making it dense, which scored the features in the following order.
| Feature | Score |
|---|---|
| exercised_stock_options | 6.845 |
| loan_advances | 6.688 |
| total_stock_value | 5.476 |
| bonus | 5.120 |
| salary | 3.052 |
| total_payments | 2.784 |
| long_term_incentive | 2.538 |
| shared_receipt_with_poi | 2.432 |
| fraction_from_poi | 1.785 |
| other | 1.715 |
| director_fees | 1.501 |
| expenses | 1.486 |
| from_poi_to_this_person | 1.37 |
| fraction_to_poi | 1.269 |
| from_this_person_to_poi | 1.000 |
| restricted_stock | 0.5895 |
| to_messages | 0.4363 |
| deferred_income | 0.3400 |
| from_messages | 0.06873 |
| deferral_payments | 0.06069 |
| restricted_stock_deferred | 0.003506 |
I used the select_features__k from SelectKBest to algorithmically find the best number of features, using the chi2 score together with the DecisionTreeClassifier and the Pipeline functions as follows:
n_features = np.arange(1, len(features_list))

pipe = Pipeline([
    ('select_features', SelectKBest(chi2)),
    ('classify', tree.DecisionTreeClassifier())
])

param_grid = [{'select_features__k': n_features}]
Then, I used GridSearchCVto automate the process of finding the optimal number of features based on their F1 score as follows:
tree_clf= GridSearchCV(pipe, param_grid=param_grid, scoring='f1', cv = 5)
tree_clf.fit(features, labels);
The result was:
{'select_features__k': 9}
I used the same procedure with the RandomForestClassifier and had similar results and as a result I will use the following 9 features to train the algorithms:
| Feature | Score |
|---|---|
| exercised_stock_options | 6.845 |
| loan_advances | 6.688 |
| total_stock_value | 5.476 |
| bonus | 5.120 |
| salary | 3.052 |
| total_payments | 2.784 |
| long_term_incentive | 2.538 |
| shared_receipt_with_poi | 2.432 |
| fraction_from_poi | 1.785 |
Algorithm Selection
What algorithm did you end up using? What other one(s) did you try? How did model performance differ between algorithms? [relevant rubric item: “pick an algorithm”]
I tested four supervised algorithms and one unsupervised (KMeans) for accuracy, precision and recall , calling the cross_val_score helper function to perform cross-validation using the suggested Scikit-learn parameters.
I used the test with a different number of features to see the effect the nummber of features had
The mean score and the 95% confidence interval of the score estimate are given in the table below:
KMeans performs the worst with a relative high accuracy but very low precision and recall followed by LogisticRegression. RandomForestClassifier performed better with the highest accuracy score and a high precision but with sub-requirements recall. GaussianNB has moderate accuracy but relatively good precision and recall
The DecisionTreeClassifier has the highest balance in precision and recall which is also reflected with the highest F1 score. It has moderate accuracy and actually already satisfies the project minimum scoring requirements without any extra parameter tuning. I will choose this algorithm an RandomForestClassifierfor further tuning and will try to improve their performance further.
Accuracy does not correlate with precision and recall scores in this dataset as the labels are very imbalanced as I will discuss in the Evaluation Metrics paragraph.
Parameter and Algorithm Tuning
What does it mean to tune the parameters of an algorithm, and what can happen if you don’t do this well? How did you tune the parameters of your particular algorithm? What parameters did you tune? (Some algorithms do not have parameters that you need to tune -- if this is the case for the one you picked, identify and briefly explain how you would have done it for the model that was not your final choice or a different model that does utilize parameter tuning, e.g. a decision tree classifier). [relevant rubric items: “discuss parameter tuning”, “tune the algorithm”]
Hyper-parameters are parameters that are not directly learnt within estimators. By tuning them we try to achieve the maximum score for the given model.
The process of parameter and algorithm tuning needs caution because overtuning one or more of the the model paramaters may result in too high variance / low bias (overfitting) and undertuning in too high bias / low variance (underfitting)
Scikit-learn has the GridSearchCV method which exhaustively generates candidates from a grid of parameter values and provides a dictionary with the best performing ones:
I used GridSearchCV to calculate the best possible parameters for the DecisionTreeClassifier from the following grid of possible choices:
'criterion': ['gini', 'entropy'],
'min_samples_split': [2, 4, 6, 8, 10, 20],
'max_depth': [None, 5, 10, 15, 20],
'max_features': [None, 'sqrt', 'log2', 'auto']
GridSearchCV gave me the following best parameter combination:
{'criterion': 'entropy',
 'max_depth': 10,
 'max_features': 'log2',
 'min_samples_split': 2}
For the DecisionTreeClassifier i used the following parameter grid:
"n_estimators": [9, 18, 27, 36],
"max_depth": [None, 1, 5, 10, 15],
"min_samples_leaf": [1, 2, 4, 6]
and got these optimized parameters:
{'max_depth': 10, 'min_samples_leaf': 1, 'n_estimators': 27}
I used these parameters to fit the models which gave the following results:
After parameter tuning RandomForestClassifier improved the recall score but decreased on the precision score while the DecisionTreeClassifier showed a significant improvement over the previous results and is the classifier that I will use.
Validation
What is validation, and what’s a classic mistake you can make if you do it wrong? How did you validate your analysis? [relevant rubric items: “discuss validation”, “validation strategy”]
Training a model on a dataset and then testing on the same data can lead to illusion that the model is performing very well but it is actually overfitting and failing to generalize on data that it has not seen yet.
For this reason it is common practice when performing a (supervised) machine learning experiment to hold out part of the available data as a test set X_test, y_test.
When evaluating different parameters, there is still a risk of overfitting on the test set because the parameters can be tweaked until the estimator performs optimally. To solve this problem, yet another part of the dataset can be held out as a so-called validation set: training proceeds on the training set, after which evaluation is done on the validation set final evaluation can be done on the test set.
A more sufficient validation method is called cross-validation. In the basic approach, called k-fold CV, the training set is split into k smaller sets. A model is then trained using k-1 of the folds as training data and the resulting model is validated on the remaining 1 fold.
The performance measure reported by k-fold cross-validation is then the average of the values computed in the loop.
This approach can be computationally expensive, but does not waste too much data.
Since our dataset is small I used cross-validation by calling the cross_val_score helper function from Scikit-learn with a number of 5 kfolds .
(Although StratifiedKFold is recommended in the case of imbalanced classes I observed a higher performance with cv=5)
Evaluation Metrics
Give at least 2 evaluation metrics and your average performance for each of them. Explain an interpretation of your metrics that says something human-understandable about your algorithm’s performance. [relevant rubric item: “usage of evaluation metrics”]
Accuracy measures the percentage of the predictions that where correct but can be misleading as in this dataset where POIs represent only the 12.9% of the total individuals.
Precision-Recall is a useful measure of success of prediction when the classes are very imbalanced. In information retrieval, precision is a measure of result relevancy, while recall is a measure of how many truly relevant results are returned.
Precisionmeasures:Of all the samples we classified as true how many are actually true?Recallmeasures:Of all the actual true samples how many did we classify as true?
The F1 score can be interpreted as a weighted average of the precision and recall, where an F1 score reaches its best value at 1 and worst score at 0.
- A precision score of 0.51 means that 51% of the persons labeled as POI were indeed persons of interest.
- A recall score of 0.42 means 42% of persons of interest in the dataset where correctly identified
These metrics, although above project specifications, still seem rather low and further work with feature engineering may possibly help increase them.
Sources
- http://scikit-learn.org/stable/modules/feature_selection.html
- http://scikit-learn.org/stable/modules/model_evaluation.html
- http://scikit-learn.org/stable/modules/generated/sklearn.model_selection.GridSearchCV.html
- http://scikit-learn.org/stable/auto_examples/model_selection/plot_precision_recall.html
- https://www.quora.com/What-is-the-best-way-to-understand-the-terms-precision-and-recall
- http://scikit-learn.org/stable/modules/generated/sklearn.tree.DecisionTreeClassifier.html#sklearn.tree.DecisionTreeClassifier